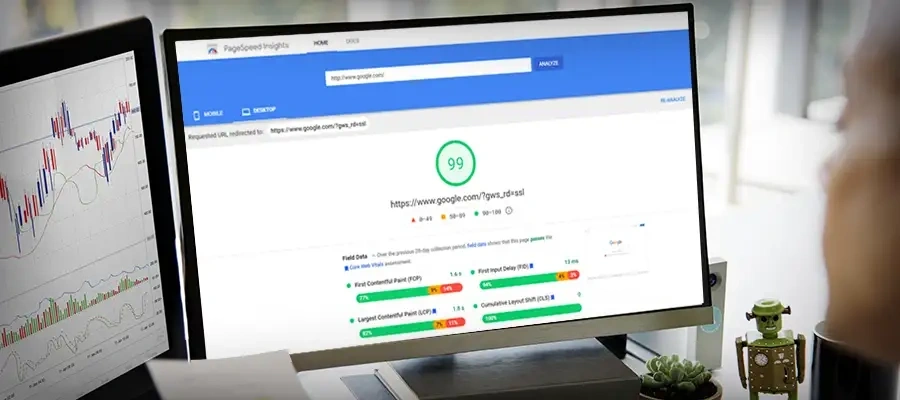
Last year, Google announced that the user experience signal fed into its search ranking algorithm is undergoing an update, initially for mobile and, shortly thereafter, for desktop as well. This update, whose rollout is planned to begin in mid-June 2021, will add Core Web Vitals, or more generically Real User Monitoring (RUM), to its metrics for measuring a user’s loading experience when visiting a website. These metrics go beyond how fast the page loads and attempt to illuminate how the page load feels to the user. Obviously subjective, this feeling can be impacted by multiple factors including when the origin server responds, when the most important content is made available to the user and how smooth the user’s interaction is. This is the focus of RUM.
To capture these metrics, a 3rd-party Javascript tag must be injected into every relevant web page, either manually or via a tag manager. To streamline this process, Webscale rolled out functionality in Q1 of this year that injects our RUM measurement tag into eligible webpages for customers that opt-in. This tag measures important page load metrics, namely:
- Time to first byte
- Domain Object Model (DOM) interactive
- DOM content loaded
- Ready state interactive
- First contentful paint
- Largest contentful paint
- Page Load Time
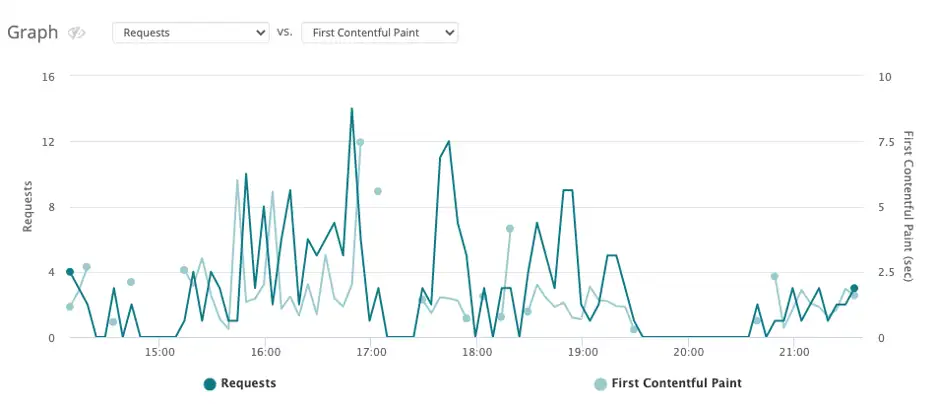
These metrics are collected and attached to the pageview logs created for each page load, now available on Webscale’s Control Panel. Each metric has been chosen to provide insight into the various parts of the page load process including latency the user will perceive and the time it takes their browser to parse the response and paint it to the screen. Webscale RUM is easy to enable and available to all our customers immediately.


Network and Server Latency
After a user decides to visit a page, they’ll wait. They’ll wait for the DNS lookup to occur. They’ll wait for any connection handshaking to occur. And they’ll wait for the origin server to process the request and return the page. This latency is nicely captured in the time to first byte (TTFB) metric. The measurement starts when the user points their browser at a page and finishes when the browser gets the first byte of the response.
Interactive Content
To measure when a page becomes interactive, three similar but subtly different metrics are collected: DOM interactive, DOM content loaded and ready state interactive. The page’s DOM must be created and loaded before a user can interact with the page, which makes these metrics a good heuristic for interactivity.
Synchronous Javascript will prevent DOM construction as the browser’s parser must stop, load the script and wait for it to execute before parsing the rest of the page’s content. As a result, pages with synchronous Javascript will have larger DOM interactive timings, as this event will only fire after the DOM is created. Afterwards, deferred Javascript is executed and the DOM content loaded event is fired. At this point, the browser can begin to paint to the user’s screen.
Useful Content
A user will begin seeing the content as the browser starts painting. This “first contentful paint” is how long it took from the user’s initial request to when they start seeing a page in their browser. This paint will fill an otherwise empty screen and recapture the user’s attention. The largest content paint metric captures when the largest piece of text or image content is fully painted. This can be used as a heuristic for when a page becomes “useful” to a user.
In general, minimizing each of these metrics will lead to snappier pages, smoother user experiences and happier customers. Being aware of current users’ experience has always been important for converting sales and has taken on added significance with Google’s update. Now is the best time to capture, monitor and analyze this experience with the help of RUM metrics.
Like to learn more about how Webscale is helping customers stay ahead of Core Web Vitals? Reach out to us at info@webscale.com

![[INFOGRAPHIC] ECOMMERCE HOLIDAY SHOPPING 2022: WHAT TO EXPECT AND HOW TO PREPARE?](https://www.webscale.com/wp-content/uploads/2022/11/infographic-ecommerce-holiday-shopping-2022-what-to-expect-and-how-to-prepare-430x191.webp)
![[INFOGRAPHIC] THE GLOBAL ECOMMERCE SECURITY REPORT](https://www.webscale.com/wp-content/uploads/2022/11/Security-Report-blogbanner-430x191.webp)


